






















Home 02
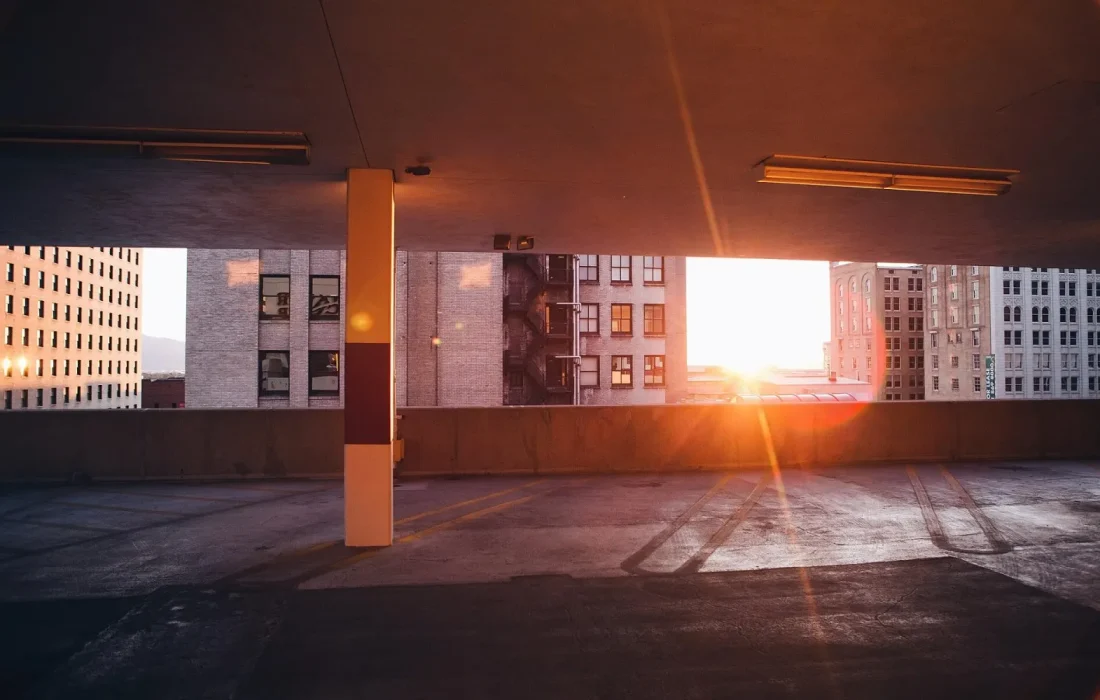
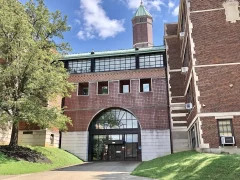
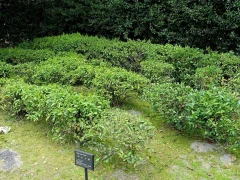
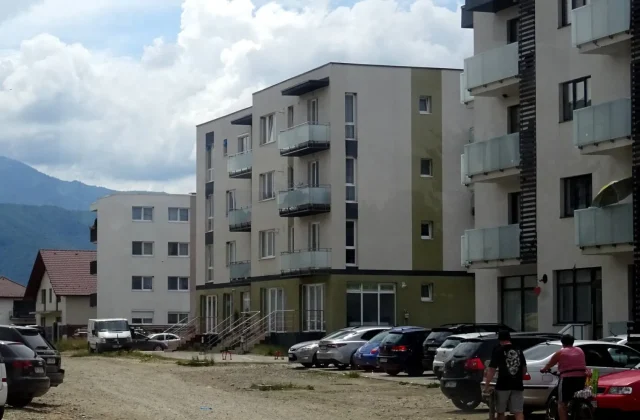
In maps: How many minutes does it take to walk to a park in each neighborhood?
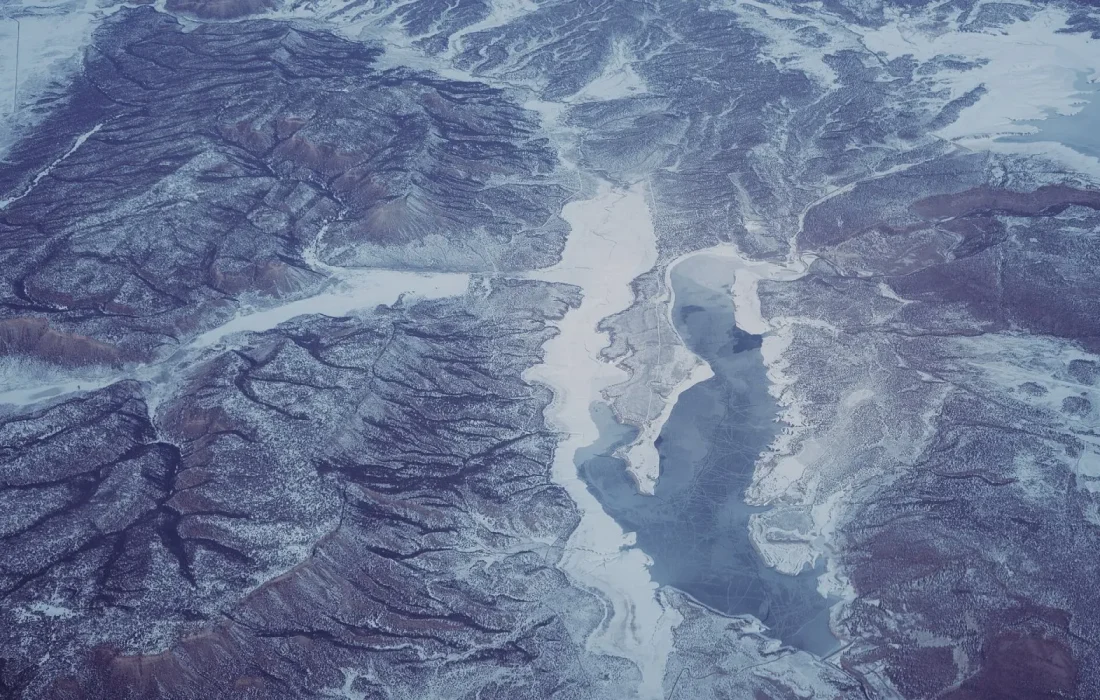
We matched green spaces in major cities with population data. In some neighborhoods, walking to the nearest park takes half an hour.
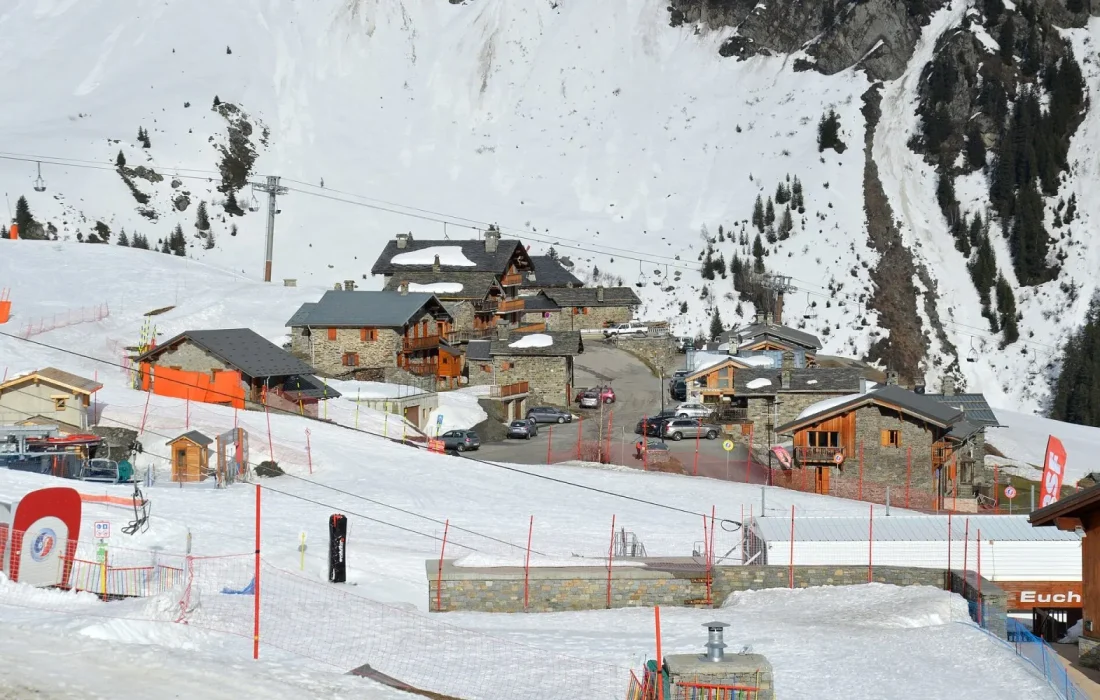
The data speak: The regional gap in school achievement is widening
We analyzed five years of exam results by region and district. The findings show that students' achievement varies dramatically depending on where…
Dashboard
| Annual inflation (%) | 28.9 | 29.8 | -0.9 |
|---|---|---|---|
| Unemployment (%) | 8.4 | 8.6 | -0.2 |
| Policy rate (%) | 38.0 | 39.5 | -1.5 |
| Growth, quarterly (%) | 3.2 | 2.9 | 0.3 |
| Current account ($bn) | -2.1 | -3.4 | 1.3 |
| Home sales (thousands) | 118.6 | 104.2 | 14.4 |
Kaynak: TÜİK, TCMB (örnek veri)
Analysis

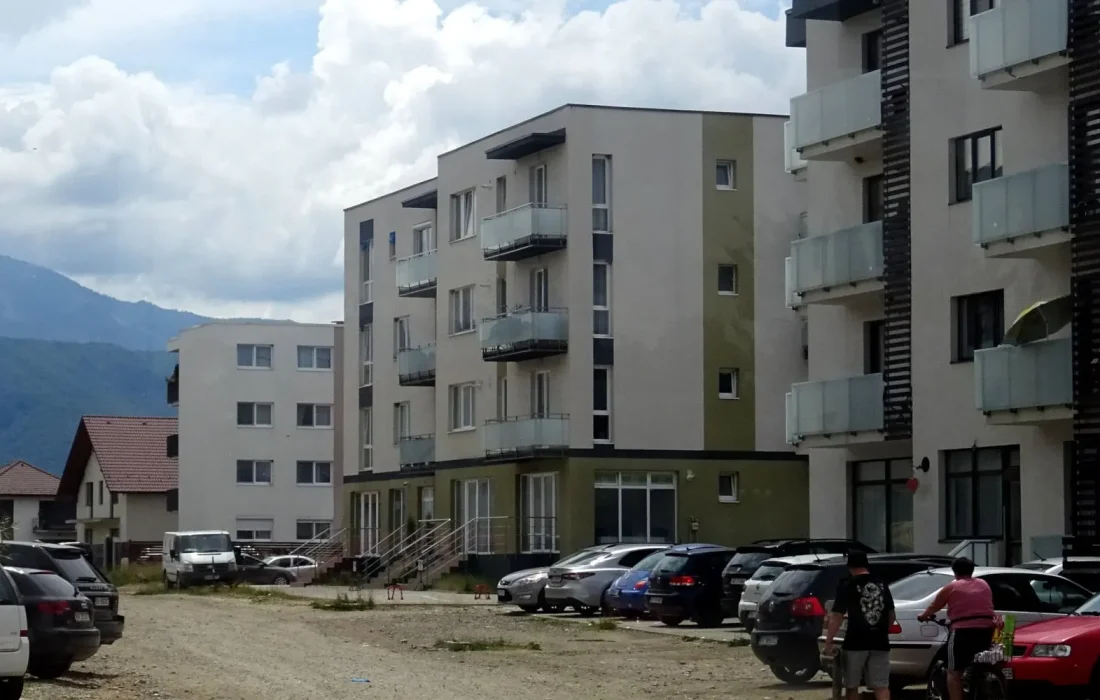
Rent or salary? We calculated young people’s housing burden over the past decade
Using ten years of data, we calculated how much of a recent graduate's salary goes to rent. The result explains why young…

How Do We Collect Our Data?
What are our sources?
The national statistics office, the central bank, government open-data portals and our own datasets compiled through freedom-of-information requests.
How do we verify the data?
Every dataset is independently recalculated by two editors; any inconsistencies are confirmed with the source agency.
Can I access the raw data?
Yes. Every story comes with a CSV file and calculation notes, shared under an open license.
What happens if I find an error?
Your correction request is reviewed within 48 hours; corrections are announced at the end of the story with their date.
A chart's journey
-
Step 1 of 4
Collection
Official sources, open-data portals and freedom-of-information requests.
-
Step 2 of 4
Cleaning
Units are standardized; missing and faulty rows are flagged.
-
Step 3 of 4
Independent calculation
Two editors recalculate the same result separately.
-
Step 4 of 4
Publication and raw data
The chart, methodology note and CSV file are published together.
Told in Charts

 AI-generated fake audio: A new era at the fact-checking desk3 November 2026
 Heat waves in the Mediterranean: Is the tourism map being redrawn?1 November 2026
 Dr. Hannah Keller, a border-town doctor, looks back: Everything that changed in twenty years31 October 2026
 Video analysis: Living on the minimum wage, how does a household budget work today?25 October 2026