



























































Table of contents
Access to green space is one of the most basic measures of quality of life in a city. In this study, we used open map data and neighborhood-level population figures to calculate the walking time from every neighborhood to its nearest park. The results reveal a clear inequality between older neighborhoods close to city centers and fast-growing areas on the urban fringe. In some densely populated neighborhoods, green space per person is just a few square meters. Public health experts say that the lack of a park within walking distance increases inactivity among children and older people.
Method: How we measured green space
We measured walking time not as the crow flies but along actual pedestrian routes. We added the sidewalks, stairways and crossings in open map data to the network. Otherwise, a neighborhood cut in two by a highway might look close to a park while in practice being unable to reach it. We measured each neighborhood not from its center point but from points weighted by housing density. That way, the areas where people actually live counted for more than vacant land.
How we defined a park also mattered. We left out green pockets under a thousand square meters, grass strips beside parking lots and the gardens of gated communities. Neighborhood populations came from the latest address-based registry. In the end, we built a single table covering roughly four hundred neighborhoods, with walking time, area per person and population density.
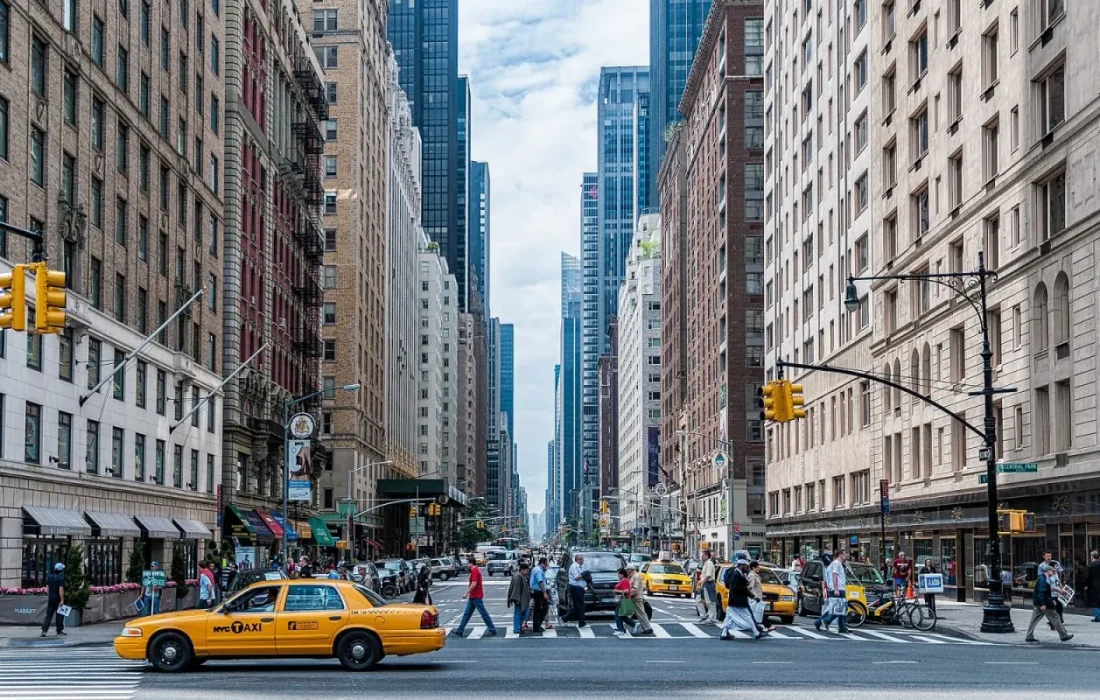
A park is the simplest test of whether a city treats everyone equally.
Mark Ellison
The gray islands on the map
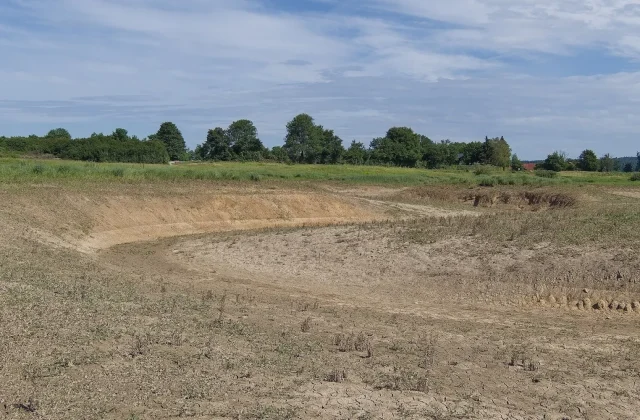
When we colored in the map, the gray islands were mostly clustered in neighborhoods on the urban fringe. In these fast-developing areas, land set aside for parks sometimes exists on the zoning plan but has never been built. In one district, a third of the planned park space is still vacant land. In some neighborhoods, the walk to the nearest park approaches half an hour. Families living there say they have to find a shuttle or a car just to take their children to a park.
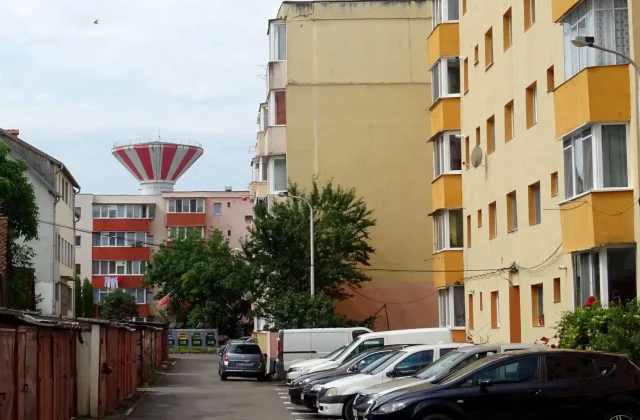
The older central neighborhoods are at the other end of the scale. There are plenty of parks, but because the population is so dense, the area per person is still low. In other words, the issue is not just distance but capacity. In one neighborhood, a single small park serves ten thousand people, and there is almost nowhere to sit in the evening.
How does distance to a park affect health?
Public health experts say walking distance to a park shapes how much people move each day, especially children and older people. Studies suggest that households near a park spend more time outdoors. We did not measure this relationship with our own data, but experts warn that the inequality could show up in health services in the years ahead. That warning is a reminder that green space policy should also be treated as health policy.
| Topic | Data |
|---|---|
| Highlights | data journalism, urban renewal, public health |
| Reading time | 8 minutes |
| Written by | Mark Ellison |
Key takeaways
- Walking time was calculated for each neighborhood along the actual pedestrian network.
- The gray islands are mostly clustered in fast-developing fringe neighborhoods.
- School yards and small community gardens are proposed as quick fixes.
Planners believe the solution lies less in big parks than in small, scattered green spaces. Turning vacant lots into temporary community gardens, opening school yards on weekends and adding shaded seating at transit stops stand out as relatively low-cost steps. Our full table is openly published, so every neighborhood can see its share. Our methodology notes and calculation steps are on the same page.

2 Comments
Really useful piece, thank you for putting it together.
I had never thought about this side of it. Looking forward to a follow-up.