















Journalism with satellite imagery: What do we see when we look from space?
From forest loss to illegal construction, satellite imagery has become one of investigative journalism's most powerful tools. We share our methods.
Table of contents
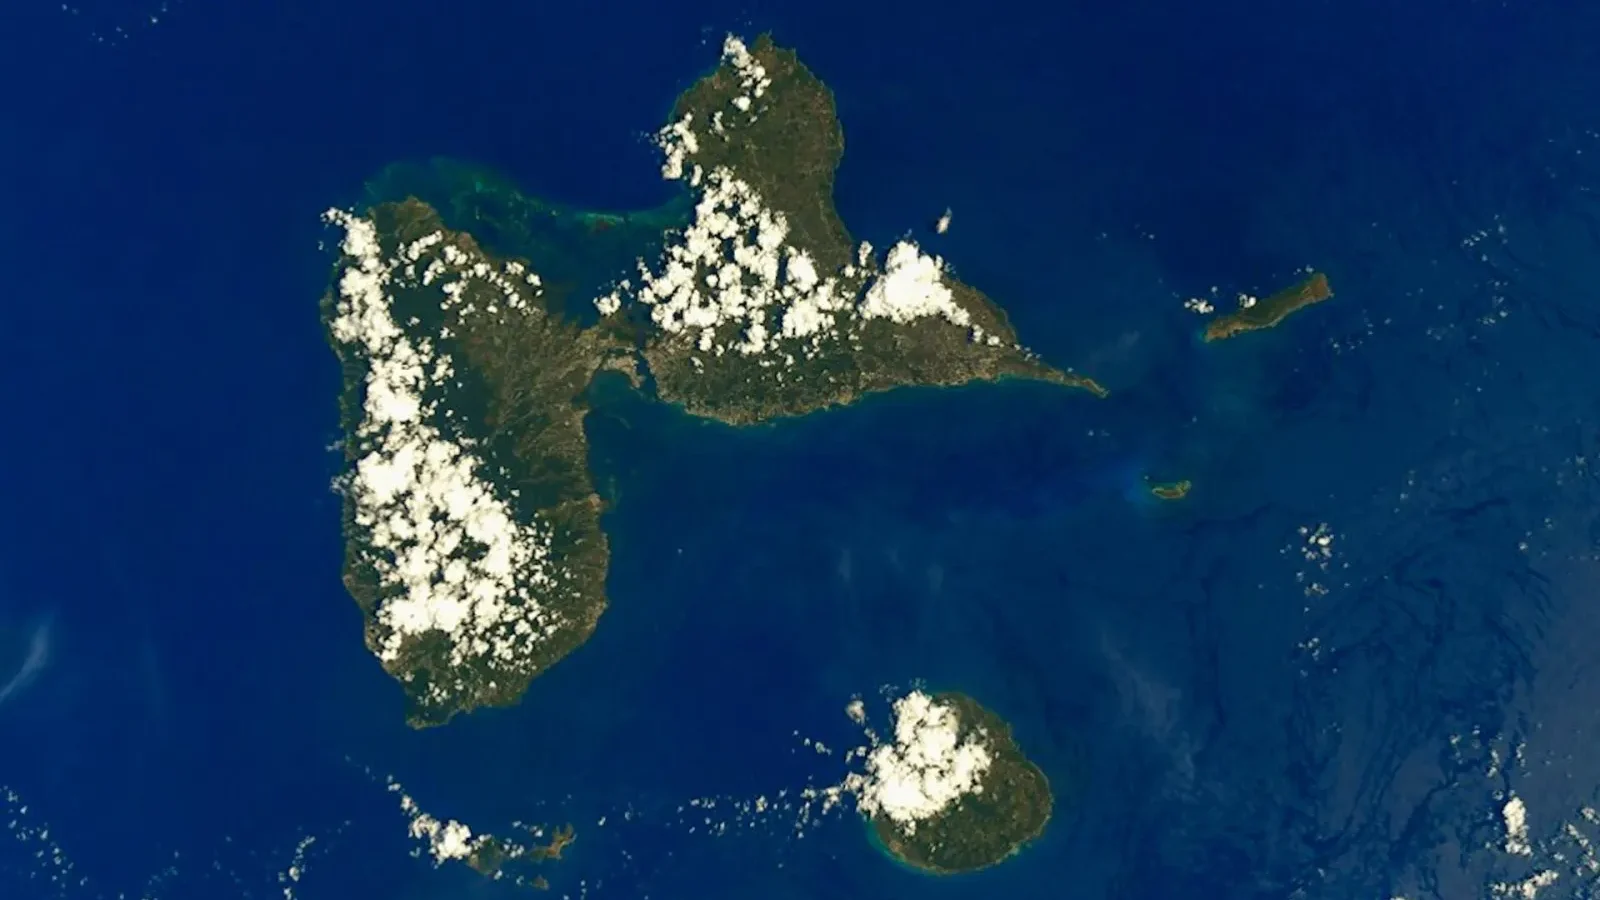
Satellite imagery, once available only to governments and large institutions, is now within journalists' reach thanks to open-data platforms. Over the past year, our team has used satellite images to document forest loss, coastal land reclamation and shrinking lakes. Our data editor Cassie Osborne explains that comparing images taken on different dates reveals changes that could be missed on the ground. But factors such as cloud cover, seasonal differences and resolution limits call for careful interpretation. In this piece, we share the basic methods for colleagues who want to work with satellite data.
Access to open satellite data
Access to open satellite data is something that was unimaginable just a few years ago. Programs run by some space agencies publish imagery that anyone can download. Our data editor Cassie Osborne explains that the resolution of these images isn't enough to make out the roof of a building, but it's more than enough to calculate the size of a forest, a lake or an area of coastal reclamation.
To get started, we recommend free imaging tools and their map-based interfaces. A few hours is enough to learn basic concepts such as observation date, cloud cover and band selection. Our team uses the same checklist for every new investigation: which image date, which band, which resolution and which area boundary. This list makes the findings reproducible.
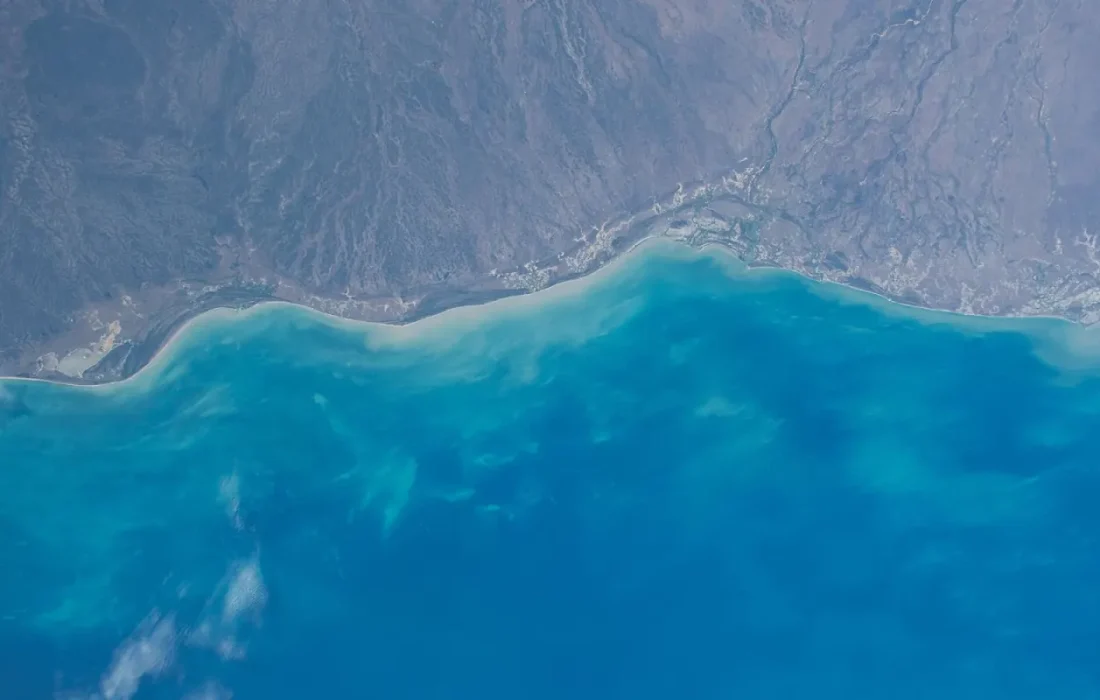
Satellites don't lie, but if they're misread, they can mislead.
Jake Morales
Before-and-after comparisons
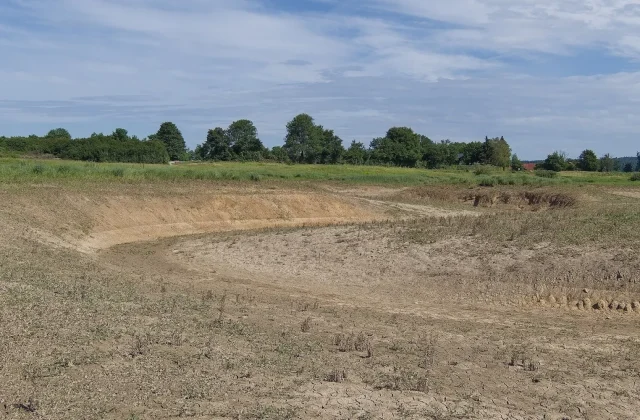
Before-and-after comparisons are the most powerful technique in satellite journalism. When two images of the same area taken on different dates are placed side by side, changes that the eye would miss become clear. Using this method, our team documented unauthorized clearing in a forest, a reclaimed area along a coast and a shrinking lake surface. In each case, the findings were also verified against testimony on the ground.
Osborne stresses that for a comparison to be accurate, you need images taken in the same season. Comparing a field that dries out in summer with a field that's green in winter can suggest a change that isn't there. Likewise, shadows and the angle of the sun affect how things look. The team requires every before-and-after pair to be assessed independently by two people.
How to avoid getting it wrong
There is always a risk of error when interpreting satellite data. Cloud cover makes some dates unusable, resolution hides small objects and seasonal differences can be deceptive. An area that looks dark in an image could be a burn scar, but it could just as well be a shadow or an irrigated field. That's why findings need to be backed up by observation on the ground and by documents.
| Topic | Science & Technology |
|---|---|
| Highlights | data journalism, investigation, climate crisis |
| Reading time | 8 minutes |
| Written by | Jake Morales |
Key takeaways
- Free satellite imagery is enough to monitor changes in forests, coastlines and lakes.
- Before-and-after comparisons should use images from the same season.
- A finding shouldn't be published alone; verify it on the ground and with documents.
Our advice to colleagues is never to publish a satellite finding on its own. Back it up with local sources, official documents and, if necessary, an expert opinion. Also, share the details of your method with readers: which image, which date, which tool. Satellites don't lie, but if they're misread, they can mislead. Transparency is the most important thing that allows readers to trust a finding.

Leave a comment